BBC Microbit
![]()


BBC micro:bit
Accelerometer Readings
Introduction
This project uses Visual Basic to read and display raw accelerometer readings from the micro:bit. The readings are sent down the USB cable and displayed in continuous real-time line graphs.
To write the program, I used Visual Basic 2015 in the Visual Studio 2015 Community Edition. This is free to download and use. Other versions are likely to work the same for this program.
You need to be working on a PC that has the correct serial port driver installed. You can download the driver from here.
MicroPython Program
To get things started, we need a MicroPython program to send the accelerometer readings in a way that can be easily read by Visual Basic.
from microbit import *

while True:
    print(
        '{:04x}'.format(accelerometer.get_x() & ((1<<16) - 1), 4),
        '{:04x}'.format(accelerometer.get_y() & ((1<<16) - 1), 4),
        '{:04x}'.format(accelerometer.get_z() & ((1<<16) - 1), 4),
         sep='', end ='Q'
    )
    sleep(50)
Our program is sending characters. The format statements ensure that we send 4 hexadecimal characters for each reading. When we use this method to output information in hexadecimal, Python does not deal properly with negative numbers. The bitwise logical operations do that work for us. The last two parameters of the print statement ensure that there are no gaps between our readings (so 12 hex digits on the trot) and that the letter 'Q' will be used to indicate the end of a line. This proves to be more reliable to read than line breaks.
Visual Basic - The Form
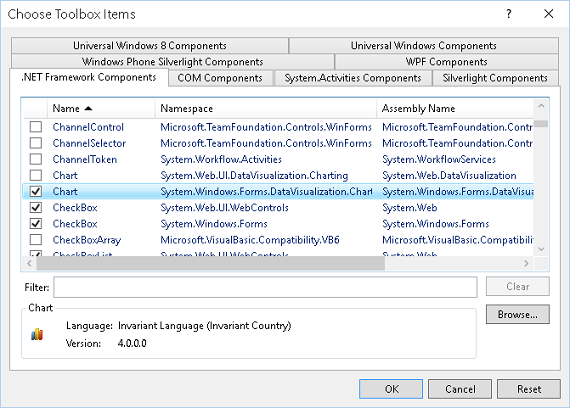
To start, you will need to make sure the charting tools are available. Go to the Tools menu and select the Choose ToolBox Items option. Look for the Chart component and make sure that it is checked.
The form will look a bit like this,
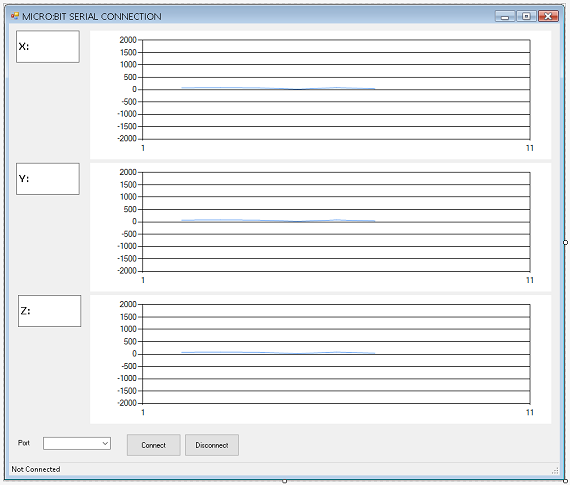
Start by creating 3 labels. These are the boxes on the left that say X: Y: and Z: in them. Call them lblX, lblY and lblZ. Set the AutoSize property to False and choose the font you like.
Towards the bottom of the form, we have a ComboBox called cmbPort and buttons called btnConnect and btnDisconnect
At the very bottom of the form, a StatusStrip has been added. A ToolStripStatusLabel has been added to the StatusStrip and has been named tsConnection.
The graphs need the most setting up. Look in the components section under Data and add a chart control. Name it chartX. You will need to look for and set the following properties. We will do all of this work on a single control before copying it to make the other two.
Select the ChartAreas property and then edit the Axes . Set the Interval of the X axis to 10. Set the Interval of the Y axis to 500 and set the Scale maximum and minimum to 2000 and -2000.
Now go to edit the Series property. Set the ChartType for the series to Line.
Copy and paste your graph now so that you have 3 chart controls named chartX, chartY and chartZ.
Visual Basic - Programming
If everything has been named as indicated above, you should be able to copy and paste this code into the code window without creating any errors,
Imports System.IO.Ports

Imports System.Text.RegularExpressions


Public Class Form1


   Dim WithEvents sp As New SerialPort

   Dim counter As Long = 0

   Delegate Sub myMethodDelegate(ByVal [text] As String)

   Dim myDelegate As New myMethodDelegate(AddressOf ShowString)


   Private Sub GetSerialPortNames()

      For Each sport As String In My.Computer.Ports.SerialPortNames

         cmbPort.Items.Add(sport)

      Next

   End Sub


   Sub ShowString(ByVal myString As String)

      Dim pattern As Regex = New Regex("[0-9a-f]{12}")

      If pattern.IsMatch(myString) Then

         Dim x As Integer = Convert.ToInt16(myString.Substring(0, 4), 16)

         Dim y As Integer = Convert.ToInt16(myString.Substring(4, 4), 16)

         Dim z As Integer = Convert.ToInt16(myString.Substring(8, 4), 16)

         lblX.Text = "X:" & Str(x)

         lblY.Text = "Y:" & Str(y)

         lblZ.Text = "Z:" & Str(z)

         UpdateCharts(x, y, z)

      End If

      Application.DoEvents()

   End Sub


   Sub UpdateCharts(x As Integer, y As Integer, z As Integer)

      chartX.Series("Series1").Points.AddXY(counter, x)

      While chartX.Series("Series1").Points.Count > 100

         chartX.Series("Series1").Points.RemoveAt(0)

      End While

      chartX.ChartAreas("ChartArea1").AxisX.Minimum = chartX.Series("Series1").Points(0).XValue

      chartX.ChartAreas("ChartArea1").AxisX.Maximum = chartX.Series("Series1").Points(0).XValue + 100


      chartY.Series("Series1").Points.AddXY(counter, y)

      While chartY.Series("Series1").Points.Count > 100

         chartY.Series("Series1").Points.RemoveAt(0)

      End While

      chartY.ChartAreas("ChartArea1").AxisX.Minimum = chartY.Series("Series1").Points(0).XValue

      chartY.ChartAreas("ChartArea1").AxisX.Maximum = chartY.Series("Series1").Points(0).XValue + 100


      chartZ.Series("Series1").Points.AddXY(counter, z)

      While chartZ.Series("Series1").Points.Count > 100

         chartZ.Series("Series1").Points.RemoveAt(0)

      End While

      chartZ.ChartAreas("ChartArea1").AxisX.Minimum = chartZ.Series("Series1").Points(0).XValue

      chartZ.ChartAreas("ChartArea1").AxisX.Maximum = chartZ.Series("Series1").Points(0).XValue + 100


      counter += 1

      If counter > Int64.MaxValue - 1 Then

         counter = 0

      End If

   End Sub


   Private Sub SerialPort_DataReceived(ByVal sender As Object, ByVal e As SerialDataReceivedEventArgs) Handles sp.DataReceived

      Dim str As String = ""

      While sp.BytesToRead > 14

         str = sp.ReadLine()

         Invoke(myDelegate, str)

      End While

   End Sub


   Private Sub btnConnect_Click(sender As Object, e As EventArgs) Handles btnConnect.Click

      Try

         sp.BaudRate = 115200

         sp.PortName = cmbPort.SelectedItem.ToString

         sp.Parity = Parity.None

         sp.DataBits = 8

         sp.StopBits = 1

         sp.DiscardNull = True

         sp.NewLine = "Q"

         sp.Open()

         If sp.IsOpen Then

            btnConnect.Visible = False

            cmbPort.Enabled = False

            tsConnection.Text = "Connected on " & sp.PortName

            btnDisconnect.Visible = True

            sp.DiscardInBuffer()

         End If

      Catch

         sp.Close()

      End Try

   End Sub


   Private Sub Form1_Load(sender As Object, e As EventArgs) Handles MyBase.Load

      Try

         GetSerialPortNames()

         cmbPort.SelectedIndex = 0

      Catch

         MsgBox("No ports connected.")

      End Try


      chartX.Series("Series1").Points.Clear()

      chartY.Series("Series1").Points.Clear()

      chartZ.Series("Series1").Points.Clear()

   End Sub


   Private Sub btnDisconnect_Click(sender As Object, e As EventArgs) Handles btnDisconnect.Click

      Try

         sp.Close()

         btnConnect.Visible = True

         btnDisconnect.Visible = False

         cmbPort.Enabled = True

         tsConnection.Text = "Not connected"

         Exit Sub

      Catch

         MessageBox.Show("Some kind of problem.")

      End Try

   End Sub


End Class
Key things to note in this code are,
- In the connection code, we specify the NewLine character as a letter Q. This proved more reliable to detect than relying on the combination of carriage return and line feed.
- In the DataReceived event, we read as many lines from the serial port as are available. Each time we do this, we are reading a line at a time. That should be our 12 hexadecimal characters.
- In the ShowString procedure, we use regular expressions to check that we have something that appears to be a 12 character hexadecimal string. If so, we convert it back into 3 x 16 bit integers.
- The UpdateCharts procedure, we add the new data points to the graphs and then shuffle the graph to the left, removing the left most point(s) and adjusting the scale automatically. The graphs will always show the last 100 readings.
Using The Program
This program is a useful way of learning about the kinds of readings you get from the accelerometer.
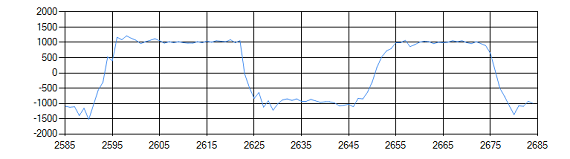
Lean the micro:bit to the left and to the right. Watch the graph of the X reading. You should get something like this,
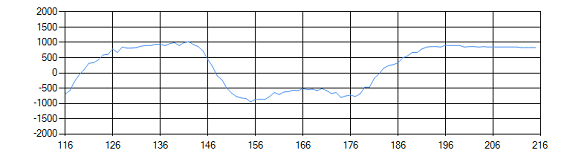
Leaning the micro:bit to the left makes the line go below zero. Leaning it to the right gives a positive result. Our readings are from -1000 to 1000.
Now try leaning backwards and forwards whilst trying to keep the X axis relatively still. You get something like this,
Leaning forward gives a negative reading, backwards positive. The numbers are in a similar range to the X readings.
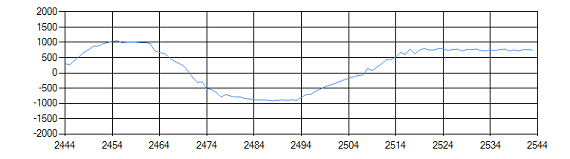
Finally, turn the micro:bit upside down and then the right way up again. Watch the Z readings,
We get a reading of -1024 when the micro:bit is the right way up. This flips to a positive number when we turn the whole thing upside down.
Challenges
- Remember the built-in gestures. Use your graphs to work out what readings on the accelerometer would be used to trigger these events.
- The application shows a reliable way to pass sensor readings over the serial port and read them in Visual Basic. You can adapt the program by removing the graphs and then doing something more interesting with the readings from the accelerometer.
- Alternatively, pass readings from a different sensor over the serial port, using the same hexadecimal character technique. Make a continuous line graph from these readings instead.